Search This Blog

Wednesday, 6 November 2013

The Advantages of Business Intelligence


Business intelligence usually refers to computer software and other tools that collect all sorts of complex business data for a company and condense it into reports. The collected data may focus on a specific department, or give an overall view of the company's status. Large corporations with huge amounts of data to process are most likely to benefit significantly from business intelligence, though smaller concerns use it, as well. Business intelligence may help a company identify its most profitable customers, trouble spots within its organization, or its return on investment for certain products. Although a companywide business intelligence system is complex, costly and time-consuming to establish, when implemented and used correctly, its benefits can be significant.

Fact-Based Decisions


Once a company-wide business intelligence system is in place, management is able to see detailed, current data on all aspects of the business -- financial data, production data, customer data. They can read reports that synthesize this information in pre-determined ways, such as current return on investment reports for individual products or product lines. This information helps management make fact-based decisions, such as which products to concentrate on and which ones to discontinue.

Improves Sales and Negotiations


A business intelligence system can be a valuable asset to a company's sales force because it provides access to up-to-the-minute reports that identify sales trends, product improvements or additions, current customer preferences and unexplored markets. Detailed and current data is also a valuable backup to negotiations with suppliers or other vendors.


Eliminates Waste


A business intelligence system can point out areas of waste or loss that may have previously gone unnoticed in a large organization. Since a companywide business intelligence system works as a single, unified whole, it can analyze transactions between subsidiaries and departments to identify areas of overlap or inefficiency. According to the CIO website, in 2000 "with the help of [business intelligence] tools, Toyota realized it had been double-paying its shippers to the tune of $812,000."

Identifies Opportunities


Business intelligence can help a company assess its own capabilities; compare its relative strengths and weaknesses against its competitors; identify trends and market conditions; and respond quickly to change -- all to gain a competitive advantage, according to the Journal of Theoretical and Applied Information Technology. It helps decision makers act swiftly and correctly in response to opportunities; helps the company identify its most profitable customers, as well as potentially profitable customers; and assess the reasons for customer dissatisfaction before it begins to cost them sales.


Credit:   by Mary Strain, Demand Media


Ejemplo Macro vba en Excel – Informe automático.

La automatización de tareas mediante macros vba en Excel nos otorgan numerosas ventajas como lo son la erradicación de errores de cálculos humanos, ahorro de tiempo de trabajo, resolución de cálculos complejos, eficacia, eficiencia….
Para observar las numerosas ventajas que proporcionan las macros, pongamos un ejemplo sencillo de una tarea repetitiva, imaginemos que todos los lunes al llegar al trabajo, debemos de realizar un informe acerca de los precios y códigos (referencias) actuales de los productos de la empresa, para ello disponemos de un report con el siguiente formato:

Automatización de Informes con Macros Excel.

En la primera fila tenemos el nombre del producto, en la fila inferior la referencia del producto, la fila posterior el precio y finalmente la siguiente fila esta en blanco, así sucesivamente hasta 500 productos:

                                             Formato inicial


El informe a presentar se ha de agrupar todos los productos en una única columna, representado en las columnas contiguas la referencia y precio de cada producto:


                                             Formato final


Analizando el proceso, si se realizara manualmente dicho trabajo deberíamos de hacer los siguientes pasos para cada producto:
1. Seleccionar la referencia del producto
2. “Cortar” la referencia
3. Pegarla en la celda contigua a la del nombre del producto
4. Seleccionar el precio del producto
5. “Cortar” el precio
6. Pegarlo en la celda contigua a la referencia del producto
7. Seleccionar las filas que estén en blanco
8. Borrar las filas


Ref: http://www.webandmacros.com/ejemplo_macro_excel.htm

Una Macro simple con VBA

Creación de un módulo
Una vez dentro del Editor debes hacer clic derecho sobre el título del proyecto y dentro del menú seleccionar la opción Insertar y posteriormente Módulo.

creando-tu-primera-macro-1


Se creará la sección Módulos y dentro de la misma se mostrará el módulo recién creado. Puedes saber que el módulo está abierto porque su nombre se muestra en el título entre corchetes.


creando-tu-primera-macro-2


Si el módulo no está abierto solamente deberás hacer doble clic sobre él. Posiciónate en el área de código e introduce las siguientes instrucciones


creando-tu-primera-macro-3


Antes de avanzar explicaré con detalle las instrucciones mostradas.
Subrutinas en VBA
El primer concepto que explicare es la instrucción Sub que es la abreviación de la palabra subrutina. Una subrutina no es más que un conjunto de instrucciones que se ejecutarán una por una hasta llegar al final de la subrutina que está especificado por la instrucción End Sub.
Las subrutinas nos ayudan a agrupar varias instrucciones de manera que podamos organizar adecuadamente nuestro código. Una subrutina siempre tiene un nombre el cual debe ser especificado justo después de la instrucción Sub y seguido por paréntesis.
La función MsgBox en VBA
La subrutina que acabamos de crear para este ejemplo solamente tiene una instrucción dentro la cual hace uso de la función MsgBox. Esta función nos ayuda a mostrar una ventana de mensaje de manera que podamos estar comunicados con el usuario sobre cualquier error o advertencia que necesitamos darle a conocer. Para este ejemplo he utilizado la forma más sencilla de la función MsgBox la cual solamente tiene un solo argumento que es precisamente el mensaje que necesitamos mostrar en pantalla al usuario.
Ejecutar macro
Para probar nuestro código bastará con pulsar el botón Ejecutar que se encuentra dentro de la barra de herramientas.


creando-tu-primera-macro-4


En cuanto se pulsa el botón se ejecutará el código recién ingresado y obtendremos el resultado en pantalla.


creando-tu-primera-macro-5


Listo, has creado tu primera macro la cual muestra una ventana de mensajes y despliega el texto especificado en la función MsgBox. Para guardar la macro recuerda que debes guardar el archivo como Libro de Excel habilitado para macros, de lo contrario perderás el código del módulo creado.

Fuente: Excel Total http://exceltotal.com/tu-primera-macro-con-vba/

Tuesday, 5 November 2013

What is Cloud computing ?


Cloud computing, or something within the cloud, is an expression used to describe a variety of computing concepts that involve a large number of computers connected through a real-time communication networks such as the Internet.[1] In science, cloud computing is a synonym for distributed computing over a network, and means the ability to run a program or application on many connected computers at the same time. The phrase also more commonly refers to network-based services, which appear to be provided by real server hardware, and are in fact served up by virtual hardware, simulated by software running on one or more real machines. Such virtual servers do not physically exist and can therefore be moved around and scaled up (or down) on the fly without affecting the end user - arguably, rather like a cloud.

The popularity of the term can be attributed to its use in marketing to sell hosted services in the sense of application service provisioning that run client server software on a remote location.

Advantages

Cloud computing relies on sharing of resources to achieve coherence and economies of scale, similar to a utility (like the electricity grid) over a network.[2] At the foundation of cloud computing is the broader concept of converged infrastructure and shared services.

The cloud also focuses on maximizing the effectiveness of the shared resources. Cloud resources are usually not only shared by multiple users but are also dynamically re-allocated per demand. This can work for allocating resources to users. For example, a cloud computer facility that serves European users during European business hours with a specific application (e.g., email) may realocate the same resources to serve North American users during North America's business hours with a different application (e.g., a web server). This approach should maximize the use of computing powers thus reducing environmental damage as well since less power, air conditioning, rackspace, etc. is required for a variety of functions.

The term "moving to cloud" also refers to an organization moving away from a traditional CAPEX model (buy the dedicated hardware and depreciate it over a period of time) to the OPEX model (use a shared cloud infrastructure and pay as you use it).

Proponents claim that cloud computing allows companies to avoid upfront infrastructure costs, and focus on projects that differentiate their businesses instead of infrastructure.[3] Proponents also claim that cloud computing allows enterprises to get their applications up and running faster, with improved manageability and less maintenance, and enables IT to more rapidly adjust resources to meet fluctuating and unpredictable business demand

http://en.wikipedia.org/wiki/Cloud_computing


Conectividad con Microsoft Access y Microsoft Excel


Ahora Microsoft Access aparece como una de las tecnologías disponibles de manera predeterminada:

Bingo Intelligence es una plataforma de Business Intelligence que destaca por su facilidad de uso y la potencia de las aplicaciones analíticas generadas.     (http://www.businessintelligence.es/ayuda/articulo.html?id=30)


tecnologias-disponibles-ace


Además, en la ventana para definir la conexión se ha añadido un botón para seleccionar el fichero de la base de datos:


access-excel-servidor


De esta manera, es posible crear rápidamente un catalogo y una aplicación de Business Intelligence conectándonos a una base de datos Access. Por supuesto, se pueden utilizar todas las funcionalidades que ofrece Bingo para la creación de catálogos y aplicaciones.
Técnicamente, también han cambiado algunas cosas: Hasta ahora, de manera predeterminada, se utilizaba el motor de Microsoft Jet (Microsoft.Jet.OLEDB.4.0), que ya no está soportado por Microsoft, y no dispone de driver para plataformas de 64 bits.
A partir de ahora, utilizaremos los drivers de Microsoft Access Database Engine 2010 (Microsoft.ACE.OLEDB.12.0), por lo que si deseas conectarte a bases de datos Access, o ficheros Excel, deberás instalarte este componente: Microsoft Access Database Engine 2010.
Desafortunadamente, no es posible instalar el driver de 64 bits en una máquina que tiene el Office de 32 bits (que sigue siendo lo más habitual). Por lo tanto, deberás instalar la versión de 32 bits (plataforma x86).
También conviene señalar que Microsoft desaconseja utilizar esta tecnología en el lado del servidor. Es decir: Sólo deberíamos conectarnos a ficheros Excel o Access desde soluciones locales de Bingo Intelligence. Para escenarios donde se requiera concurrencia de usuarios se recomienda migrar la base de datos a SQL Server Express, por ejemplo.
Todas estas funcionalidades ya están disponibles en la versión de evaluación.

Fuente: http://www.businessintelligence.es/blog/conecitivdad-microsoft-access-excel.html

Monday, 4 November 2013

Microsoft Access: Business Intelligence on a Shoestring

Learn how to deliver dynamic content by building a meaningful Business Intelligence Application, utilizing only what is available on the client's desktop, when a Data Warehouse BI Application, SQL Server and SSIS/SSRS aren't an option.

Introduction

Recently I was between major contracts and was contacted by an agency that I have worked for before. They had a department within a major retail bank that was having difficulties with a Microsoft Access database, which had been created to allow the department to track the results of customer satisfaction within the company. As I started life as an Access developer and had a couple of months to spare before my next major project was due to start. I agreed to look into their problems.
The database, although well written by an internal resource. was quite rudimentary in its functionality and was only used to store manual imports from excel and csv files on a monthly basis into various data tables. Following the import, the user would then have to follow a set of instructions to amend stored queries within the database to create meaningful results, which could then be exported back to excel for the team to format into graphs. Once exported the data was then used to manually create graphs and tables that would be added to a dashboard, which was used to present the data to the business. The problems, as described by the head of the department, were the fact that the database was slow and required two to three days of intensive work by a non-technical resource to input the data and then create the reports, which had produced inconsistent data due to the “human error” factor when amending the queries in the second step.
After viewing the database, I agreed to hold a meeting with the major stakeholders to discuss their actual requirements and provide guidance on what they may actually require. Following the meeting, it was obvious that the department required the following:
  • The ability to store more than the 2 GB limit of MS Access to allow trends to be forecast from stored data
  • Automated upload of delivered files
  • Automated production of the required reports including Dashboards and KPI’s
  • Automated delivery of the resultant dashboards to the company
At the meeting, I discussed my recommendations and suggested that this project would be an ideal scenario for a Data Warehouse BI Application utilizing SQL Server and SSIS/SSRS to deliver dynamic content to the department and interested parties using a Sharepoint server. The head of the department discussed my recommendations with IT and asked about the feasibility of a project to deliver the above; this however proved unsuccessful as the company was going through a merge and IT was already fully committed to upgrading the core delivery systems within the company. At this point, the head of department discussed with me if I thought there was any way I could assist. Following discussions with a colleague, who I had known from a previous role when I worked within the IT area, it was established that I could gain access to an instance of MS SQL server, which led me to believe that I could help. Following further discussions, I embarked on delivering a BI suite utilizing just those applications available on the standard desktop along with access to a SQL Server instance.

Discussion

The main focus of this project was to move the application from a rudimentary Microsoft Access Database to a fully-fledged application using whatever applications and tools that were available within the business area. Investigation of the desktop established that MS Office 2003 Professional was installed on the desktop of every user along with Adobe Distiller 6.0. This, along with the availability of an instance of SQL Server 2005, led to the decision to convert the existing MS Access database to a Microsoft Access Project connected to a SQL Server backend, which would then utilize VBA and COM to automate all those manual processes including creation and delivery of the Dashboard. Utilizing a clean MS Access Project, I connected to an instance of SQL Server 2005 on the companies’ development box and proceeded to convert the import routines from the old database into data loads and error checking routines, using vba and SQL Server stored procedures to check the data on load. Due to the requirement of no table creation imposed on the company SQL Server, it was necessary to build permanent load tables to load the data in from the ADP.
To enable grouped and summed data to be used with the output of the ADP, I adapted a dynamic pivot routine that I have used before within SQL Server 2005 – I have included an example below – this provides very similar functionality to the Cross Tab Query within MS Access.
-- =============================================
-- Author:        Peter Evans
-- Create date: 12 Jan 2008,
-- Description:   This procedure provides a list of all 
-- percent to target scores by division and month
-- for Dashboard creation.  It is called from the Front end which is a Access 
-- 2002 Front end.  Procedure is called using VBA calls.
-- parameters passed in are a non comma sep list of months for 
-- year one and year two and both year dates as integer along
-- with channel identifier and concpet identifier
-- data is returned from the View DBoardConceptScore which has a 
-- derived field MonthId which provides a sort capability for the 
-- pivot table created and also an identifer of month in varchar format
-- =============================================
 
ALTER PROCEDURE [dbo].[T100output_DBoardConceptPercData] 
      -- Add the parameters for the stored procedure here
@intChanId smallint, @strRMth1 nvarchar(2000), @intYear1 smallint,
@strRMth2 nvarchar(2000), @intYear2 smallint, @intConcept smallint
 
AS
BEGIN
 
DECLARE @colsY2 NVARCHAR(MAX)
SELECT  @colsY2 = STUFF(( SELECT DISTINCT TOP 100 PERCENT
                                '],['+ Cast(t2.MonthId as Varchar(9))
                        FROM    CalendarView AS t2 INNER JOIN 
dbo.iter_intlist_to_tbl(@strRMth1) AS i ON t2.Month = i.number      WHERE Year = @intYear1
ORDER BY '],['+ Cast(t2.MonthId as varchar(9))
                        FOR XML PATH('')
                      ), 1, 2, '') + '],'
 
SELECT @colsY2 = @colsY2 + STUFF(( SELECT DISTINCT TOP 100 PERCENT
                                '],['+ Cast(t2.MonthId as Varchar(9))
                        FROM    CalendarView AS t2 INNER JOIN 
dbo.iter_intlist_to_tbl(@strRMth2) AS i ON t2.Month = i.number WHERE Year = @intYear2
ORDER BY '],['+ Cast(t2.MonthId as varchar(9))
                        FOR XML PATH('')
                      ), 1, 2, '') + ']'
 
DECLARE @cols2 NVARCHAR(MAX)
SELECT  @cols2 = STUFF(( SELECT DISTINCT TOP 100 PERCENT
'],pvt.['+ Cast(t2.Monthid as Varchar(9))
                        FROM    CalendarView AS t2 INNER JOIN 
dbo.iter_intlist_to_tbl(@strRMth1) AS i ON t2.Month = i.number
                        WHERE Year = @intYear1
ORDER BY '],pvt.['+ Cast(t2.MonthId as Varchar(9))
                        FOR XML PATH('') 
                      ), 1, 2, '') + '],'
 
 
SELECT @cols2 = @cols2 + STUFF(( SELECT DISTINCT TOP 100 PERCENT
'],pvt.['+ Cast(t2.Monthid as Varchar(9))
                        FROM    CalendarView AS t2 INNER JOIN 
dbo.iter_intlist_to_tbl(@strRMth2) AS i ON t2.Month = i.number
                        WHERE Year = @intYear2
ORDER BY '],pvt.['+ Cast(t2.MonthId as Varchar(9))
                        FOR XML PATH('') 
                      ), 1, 2, '') + ']'
 
 
DECLARE @query NVARCHAR(MAX)
SET @query = N'
SELECT pvt.Title,' + @cols2 +'
FROM  (SELECT  t2.Title, t2.MonthId, t2.Concept, t2.PercScore    
FROM DBoardConceptScores AS t2 
WHERE t2.Concept = ' + cast(@intConcept as varchar (2)) + ' 
AND t2.ChanFk =' + cast(@intChanId as varchar(1)) + ')p 
PIVOT (Sum([percscore]) FOR [Monthid] IN (' + @colsY2 + ')) AS pvt  
ORDER BY pvt.Title'
 
EXEC (@query)
 
END
 
Once the data had been imported and saved correctly, it was then down to the matter of delivering the reports. Allowing the users to select using a form from the ADP and then using a module within vba to call a stored procedure to create the data required for the reports removed the “human error” side of the equation. Once selected, the reports run in the background, creating an excel version of each report chosen, utilizing vba com calls to open excel on the clients machine, call an existing template and populate the data using ado recordsets based on stored procedures . These reports included monthly average data and results against targets, summary data based on yearly and quarterly stored and dynamically created data and the monthly dashboard, which gave an overview of the companies’ performance against not only targets but also their competition, but utilized automatically produced charts instead of figures.
automatically produced charts
After the excel reports had been verified by the team they then required the ability to create pdf versions of the documents to be automatically emailed to branches, divisions and regions. This was achieved using pdf distiller, which had been installed on the user’s machines as standard. The emailing of the reports was achieved by leveraging the COM component of MS Access to talk to an SMTP server to create the mail item and attach the required reports and then despatch. The SMTP server was utilized to avoid the recent updates to MS Outlook security, which would have required a special script to have been written for the users despatching the mail to prevent the annoying pop up of the security warning, which would have appeared for each report (at the lowest level this would be over 700). To achieve a ‘sent’ item in the departments mail box, a copy was sent to the department group mail box and a rule run on the incoming folder to transfer mails with a certain subject line into the sent folder of the mailbox. Along with the produced reports and graphs, the users were also given the ability to generate reports as Excel files to allow further investigatory work to be completed.

Conclusion

It is possible with a little creativity and a lot of hard work to provide a form of Business Intelligence to the broader community without utilizing a Data Warehouse or any of the normal tools associated with either MOLAP or ROLAP storage. Using a mix of standard desktop applications and available storage mediums, a pseudo warehouse has been created which is accessed with SQL stored procedures controlled from the desktop. It is appreciated that this application is narrowly focused on one area of business intelligence delivery but is hoped that the ability to export slices of the stored data tables into MS Excel will allow the department to deliver extended reports based upon the Dashboard and KPI’s created. This application has already been up and running within the company for nearly two years and has had a major impact on how the company deals with its customers.

Deliverables included:

  • Automated upload of excel and cvs delivered data – including data checks for consistency and completeness of the file being uploaded.
  • Conversion of MS Access queries and modules to MS SQL Server 2005 stored procedures and functions.
  • Automated population of stored summarized data tables.
  • Leverage of MS Access COM and MS Excel COM abilities to create automated dashboard production on a monthly basis utilizing 15 individual metrics.
  • Leverage of MS Access COM and MS Outlook COM abilities to create automated monthly distribution including dynamically updateable details to each group of emails.

By Peter Evans     http://www.databasejournal.com/features/msaccess/article.php/3871841/Microsoft-Access-Business-Intelligence-on-a-Shoestring.htm

Sunday, 3 November 2013

What is Business intelligence (BI) ?


Business intelligence (BI) is a broad category of applications and technologies for gathering, storing, analyzing, and providing access to data to help enterprise users make better business decisions.

BI applications include the activities of decision support systems, query and reporting, online analytical processing (OLAP), statistical analysis, forecasting and data mining.

Business intelligence applications can be:

- Mission-critical and integral to an enterprise's operations or occasional to meet a special requirement

- Enterprise-wide or local to one division, department

- Centrally initiated or driven by user demand

This term was used as early as September, 1996, when a Gartner Group report said:

By 2000, Information Democracy will emerge in forward-thinking enterprises, with Business Intelligence information and applications available broadly to employees, consultants, customers, suppliers, and the public. The key to thriving in a competitive marketplace is staying ahead of the competition. Making sound business decisions based on accurate and current information takes more than intuition. Data analysis, reporting, and query tools can help business users wade through a sea of data to synthesize valuable information from it - today these tools collectively fall into a category called "Business Intelligence."

While the terms business intelligence and business analytics are often used interchangeably, there are some key differences:

BI vs BA
Business Intelligence
Business Analytics
Answers the questions: What happened?
When?
Who?
How many?
Why did it happen?
Will it happen again?
What will happen if we change x?
What else does the data tell us that never thought to ask?
Includes: Reporting (KPIs, metrics)
Automated Monitoring/Alerting (thresholds)
Dashboards
Scorecards
OLAP (Cubes, Slice & Dice, Drilling)
Ad hoc query
Statistical/Quantitative Analysis
Data Mining
Predictive Modeling
Multivariate Testing


BI capabilities in Excel, SharePoint Online, and Power BI for Office 365


Excel 2013 offers lots of business intelligence (BI) capabilities to help you explore and analyze data. Basic features are supported in SharePoint Online, and advanced capabilities are available in Power BI for Office 365. Read this article for an overview of the BI features that you can use in Power BI for Office 365, Excel, and SharePoint Online.


BI capabilities in Power BI for Office 365


Power BI for Office 365 is a self-service BI solution for Office 365 customers. By using Power BI for Office 365, people can easily discover, analyze, and share data through Excel and SharePoint Online, and across different devices. Key capabilities in Power BI for Office 365 include the following:


Feature Name
Description
Resources
Power Query
This is a new add-in for Excel that you can use to find and connect to data sources. You can use Power Query to combine data from different data sources, clean and transform the data, and then create custom views.
Introduction to Microsoft Power Query for Excel
Power Pivot
Power Pivot makes it easy to create a powerful but efficient Data Model in Excel. The Data Model can serve as a data source for charts, tables, and Power View sheets.
PowerPivot: Powerful data analysis and data modeling in Excel
Power View
You can use Power View to create interactive views, reports, scorecards, and dashboards.
Power View: Explore, visualize, and present your data
Power Map
This is a new add-in for Excel that makes it easy to create interactive visualizations on a three-dimensional (3D) globe.
Power Map documentation
Power BI for Office 365 sites
This is an application that transforms a basic SharePoint site into a robust, dynamic way to view and share Excel workbooks. Power BI sites on Power BI for Office 365 also provides people with an easy way to access all the BI capabilities that are included in Power BI for Office 365.
Power BI for Office 365 sites
Power BI for Windows mobile application
This is an application that lets people view and interact with Excel workbooks on a Windows tablet.
Power BI for Windows mobile application
Support for larger workbooks
Certain file size limits apply to workbooks in Office 365 that affect whether a workbook can be viewed in a browser window. Power BI for Office 365 supports larger workbooks than what’s available in SharePoint Online alone. For more information, see File size limits for workbooks in SharePoint Online.
File size limits for workbooks in SharePoint Online

These are just some of the great, new features in Power BI for Office 365. Additional BI capabilities are included. For a more detailed overview, see Getting Started with Power BI for Office 365.


Saturday, 2 November 2013

Year-to-date Balance Sheet


Year-to-date


Year-to-date is a period, starting from the beginning of the current year, and continuing up to the present day. The year usually starts on January 1 (calendar year), but depending on purpose, can start also on July 1, April 1 (UK corporation tax and government financial statements), and April 6 (UK fiscal year for personal tax and benefits). Year-to-date is used in many contexts, mainly for recording results of an activity in the time between a date (exclusive, since this day may not yet be "complete") and the beginning of either the calendar or fiscal year.

In the context of finance, YTD is often provided in financial statements detailing the performance of a business entity. Providing current YTD results, as well as YTD results for one or more past years as of the same date, allows owners, managers, investors, and other stakeholders to compare the company's current performance to that of past periods. Employees' income tax may be based on total earnings in the tax year to date.

YTD describes the return so far this year. For example: the year to date (ytd) return for the stock is 8%. This means from January 1 of the current year to date, stock has appreciated by 8%.

Another example: the year to date (ytd) rental income of a property (whose Fiscal Year End is March 31, 2009) is $1000.00 as of June 30, 2008. This means that the property brought in $1000.00 of rental income during the period April 1 through June 30, 2008 (= the ytd period for the property).

Comparing YTD measures can be misleading if not much of the year has occurred, or the date is not clear. YTD measures are more sensitive to early changes than late changes. Contrast YTD with the concept of 12-months-ending (or Year-ending), which are more resistant to seasonal influences.

Example: to calculate Year-To-Date Invoicing for a company, invoice totals for each previous month of the current year are added to total invoices for the current month to date.

 
Example: YTD Invoicing report for May 3
 
  January Invoices-----$ 35,000
  February Invoices----  40,000
  March Invoices-------  25,000
  April Invoices-------  45,000
  May Invoices---------   5,000
                        _______
                               
  YTD Invoices          150,000
 
Alternate method:
 
  1st quarter Invoices-----$ 100,000
  April Invoices-----------   45,000
  May Invoices-------------    5,000
                             _______
                               
  YTD Invoices               150,000
 

tax due as of the end of week 33 of the tax year is calculated on total pay from the beginning of week 1 until the end of week 33; tax payable for that week will be this total tax minus tax already paid.


…………….


Balance Sheet Template


This FREE Balance Sheet Template features a column for the current year and a column for the prior year. The template auto calculates Total Assets, Total Liabilities, and Total Equity.

This Balance Sheet has a classic and professional design. Enter your year to date values, and the template will auto populate all calculated fields. Shading on the spreadsheet makes it easy to compare Assets to Liabilities and Equity to ensure all accounts are in balance.

Click on the below image or link to download the spreadsheet. Choose "Open"to immediately open the template for editing, or choose "Save" to save the template to a location on your computer.

If this spreadsheet does not meet your needs, consider a
Custom Spreadsheet solution.


Excel: balance YTD (Year to Date)

Balance Year-to-Date (Año hasta la fecha) es un período, a partir del comienzo del año en curso, y continuando hasta el día de hoy. El año suele comenzar el 1 de enero ( año calendario ), pero dependiendo del propósito, puede iniciar también el 1 de julio, 1 de Abril (UK impuesto de sociedades y los estados financieros del gobierno), y 6 de abril (UK año fiscal para el impuesto y los beneficios personales). Hasta la fecha se utiliza en muchos contextos, principalmente para registrar los resultados de una actividad en el tiempo entre una fecha (exclusiva, ya que este día no puede ser “completa”) y el comienzo de cualquiera el calendario o año fiscal .
En el contexto de las finanzas, la fecha es a menudo proporcionada en los estados financieros que detallan el funcionamiento de una entidad de negocio . Proporcionar resultados del Año de actualidad, así como los resultados Rendimiento acumulado durante uno o más años anteriores a partir de la misma fecha, permite a los propietarios, gerentes, inversionistas y otras partes interesadas para comparar el desempeño actual de la empresa con la de períodos anteriores. Impuesto sobre la renta de los trabajadores pueden estar basada en los ingresos totales en el año fiscal hasta la fecha.
Fecha describe el regreso lo que va del año. Por ejemplo: el año hasta la fecha (YTD) a cambio de la población es de 8%. Esto significa que a partir del 1 de enero del año en curso hasta la fecha, las acciones se ha apreciado un 8%.
Otro ejemplo: el año hasta la fecha (YTD) los ingresos por alquiler de una propiedad (cuya Fin de ejercicio es el 31 de marzo de 2009) es de $ 1.000,00 al 30 de junio de 2008. Esto significa que la propiedad trajo $ 1,000.00 de ingresos por rentas durante el período 1 de abril al 30 de junio de 2008 (= el período acumulado anual de la propiedad).
Al comparar las medidas del Año puede ser engañosa si no la mayor parte del año se ha producido, o la fecha no está clara. Medidas del Año son más sensibles a los cambios tempranos que los cambios finales. Contraste YTD con el concepto de 12 meses de fin (o año-fin ), que son más resistentes a las influencias estacionales.
Ejemplo: para el cálculo de año hasta la fecha de facturación de una empresa, se suman los totales de las facturas de cada mes anterior del año en curso a las facturas totales para el mes en curso hasta la fecha.
Ejemplo: informe de facturación a la fecha de 03 de mayo
Enero facturas —– $ 35.000
Febrero facturas —- 40.000
Facturas de marzo ——- 25.000
Facturas abril ——- 45.000
Facturas mayo 5000 ———
_______
Fecha Facturas 150000
Método alternativo:
1er trimestre Facturas —– $ 100,000
Facturas abril ———– 45000
Las facturas de mayo ————- 5000
_______
Fecha Facturas 150000
impuesto debido al cierre de la semana 33 del año fiscal se calcula en el pago total desde el comienzo de la semana 1 hasta el final de la semana 33, el impuesto a pagar por esa semana será este impuesto menos impuesto total ya pagado.
• Quarter-To-Date (QTD)
• Mes-To-Date (MTD)
• Año-final
• Movimiento total anual (MAT)
 

 Fuente: http://en.wikipedia.org/wiki/Year-to-date
 
 
——————
Esta plantilla de balance cuenta con una columna para el año en curso y una columna para el año anterior. El auto plantilla calcula Total Activo, Pasivo total y capital total.
Este balance tiene un diseño clásico y profesional. Escriba su año de valores de fecha y la plantilla se auto rellenar todos los campos calculados. Sombreado en la hoja de cálculo hace que sea fácil de comparar activos con pasivos y patrimonio para asegurar que todas las cuentas están en equilibrio.
Haga clic en el enlace para descargar la hoja de cálculo. Seleccione la opción “Abrir” para abrir de inmediato la plantilla para la edición, o elegir la opción “Guardar” para guardar la plantilla en una ubicación de su equipo.
 
 
Fuente: http://www.practicalspreadsheets.com/Balance-Sheet-Template.html
 
 
sheet

Excel : herramienta de gestión y análisis financiero empresarial

analyzer


Es una solución de inteligencia empresarial, concebida dentro de un entorno integrado de escritorio llamado cuadro de mando o dashboard y creado para la gestión y análisis económico-financiero de una empresa. Está soportado con tecnología de inteligencia de negocios (BI) y facilita la confección, interpretación y realización del estudio y análisis total de la situación económico-financiera.
Es un sistema de soporte gerencial desarrollado para facilitar el análisis de los estados financieros de su empresa y permitir una eficaz y oportuna toma de decisiones.
Principales características del sistema:
Reportes y gráficos dinámicos de los principales estados financieros: balance general y estado de ganancias y pérdidas. Así como también, de los principales ratios financieros: rentabilidad y gestión (margen bruto, margen operativo, margen antes de impuestos, utilidad neta, EBITDA, ROA y ROE), liquidez y deuda (liquidez corriente, prueba ácida, endeudamiento patrimonial, grado de propiedad y solvencia) y actividad (rotación de inventarios, cuentas por cobrar y cuentas por pagar, periodo de rotación de inventarios y periodo promedio de cobro y pago). En todos los casos, se facilita el análisis comparativo de la información por periodos anuales y/o mensuales.
Es un sistema desarrollado completamente en Excel, muy fácil de usar y no se requiere ejecutar ningún proceso de instalación previo. Como datos de entrada, solo se requiere copiar los datos del balance de sumas y saldos o del balance de comprobación emitido por su sistema contable.


Fuente: http://gratis.portalprogramas.com/Modulo-Financiero.html

Friday, 1 November 2013

Reajustar presupuesto mediante solver en Excel


Un presupuesto elaborado en Excel con la herramienta Solver, puede ser reajustado cuánto sea necesario hasta lograr el punto deseado.

Los paso a seguir son los siguientes:

  • Activar solver en Excel 2007 y 2010
  • [Botón de office] -> [Opciones de Excel]
  • “Complementos”
  • “Ir”
  • Activar solver
  • Aceptar

Nota. En el caso de Excel 2010 hacer clic en la cinta “Archivo” -> “Opciones”.

SOLVER

Es una de las herramientas más potentes de Excel, ya que permite hallar la mejor solución a un problema, modificando valores e incluyendo condiciones o restricciones. En nuestro caso les envío una plantilla para el reajuste de presupuesto de una campaña publicitaria. Siga el proceso que se indica en la plantilla que adjunto y usted podrá disfrutar de lo que puede hacer esta herramienta por nosotros.


Pasar datos de un libro a otro en Excel

Es posible que otro libro de Excel contenga los datos que desea usar o analizar, pero que usted no sea el propietario del archivo o no quiera arriesgarse a modificarlo. Puede usar el Asistente para la conexión de datos para crear una conexión dinámica entre un libro “externo” y su libro. Para obtener acceso al Asistente para la conexión de datos, vaya a la pestaña Datos.
Importante Las conexiones a datos externos pueden estar deshabilitadas en el equipo. Para conectarse a los datos al abrir un libro, habilite las conexiones de datos en la barra Centro de confianza, o bien guarde el libro en una ubicación de confianza.
Paso 1: Crear una conexión con el libro y sus hojas de cálculo
Tenga en cuenta que las hojas de cálculo se denominan “tablas” en el cuadro de diálogo Seleccionar tabla que aparece en el paso 5.
1. En la pestaña Datos, haga clic en Conexiones.


libro1


2. En el cuadro de diálogo Conexiones del libro, haga clic en Agregar.
3. En la parte inferior del cuadro de diálogo Conexiones existentes, haga clic en Examinar en busca de más.
4. Busque el libro y haga clic en Abrir.
5. En el cuadro de diálogo Seleccionar tabla, seleccione una tabla (hoja de cálculo) y haga clic en Aceptar.
Nota Solo puede seleccionar y agregar una tabla a la vez.
6. Puesto que todas las tablas que se agregan se denominan a partir del nombre del libro, puede cambiarles el nombre por uno más significativo.
1. Seleccione una tabla y haga clic en Propiedades.
2. Cambie el nombre en el cuadro de nombre Conexión.
3. Haga clic en Aceptar.
7. Para agregar más tablas, repita los pasos del 2 al 5 y cámbieles el nombre según sea necesario.
8. Haga clic en Cerrar.
Paso 2: Agregar las tablas a la hoja de cálculo
1. Haga clic en Conexiones existentes, seleccione la tabla y haga clic en Abrir.
2. En el cuadro de diálogo Importar datos que aparece, elija dónde desea ubicar los datos en el libro y si desea ver los datos como una tabla, un informe de tabla dinámica o un gráfico dinámico.
3. Opcionalmente, puede agregar los datos al modelo de datos para combinarlos con otras tablas o datos de otras fuentes, crear relaciones entre tablas y más opciones que las que se tienen con un informe de tabla dinámica básico.
Mantener los datos del libro actualizados
Ahora que se ha conectado al libro externo, querrá tener siempre los datos más recientes en el libro. Vaya a Datos > Actualizar todo para obtener los últimos datos. Para obtener más información sobre la actualización, vaya a Actualizar datos conectados a otro libro.
Conectarse a otros tipos de orígenes de datos
¿Necesita conectarse a otros orígenes de datos, como OLE DB, fuentes de datos de Windows Azure Marketplace, Access, otro libro de Excel, un archivo de texto o uno de cualquier otro tipo? Vea los artículos siguientes para obtener más información.

Conectar datos OLE DB con el libro
Conectar una base de datos de SQL Server con el libro
Conectar una fuente de Windows Azure DataMarket con el libro
Conectar una base de datos de Access con el libro
Conectar datos externos con el libro


Fuente: http://office.microsoft.com/es-ar/excel-help/conectar-datos-de-otro-libro-con-el-libro-HA103791160.aspx

Excel, pasar datos de una hoja a otra

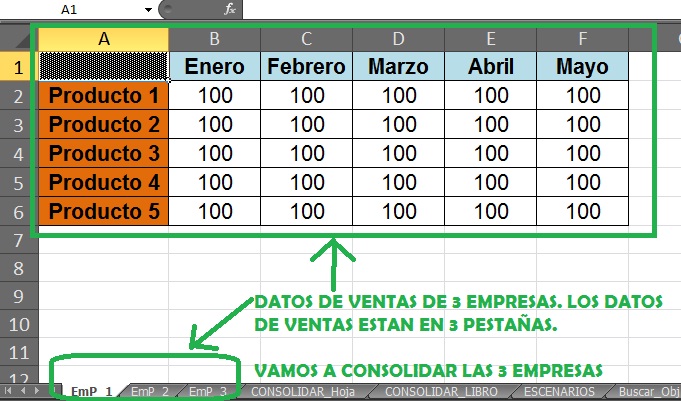
Ayuda Excel 2010 - Consolidar Datos 01


En Excel, a veces necesitamos pasar datos de una hoja a otra. Pero, al intentar utilizar la función copiar / pegar nos damos cuenta que no es posible.
Sin embargo, existen otros métodos para pasar datos de una hoja Excel a otra.
Método 1
Supongamos que tenemos dos hojas Hoja 1 y Hoja 2 y que queremos pasar un dato de la celda A1 de la Hoja 1 a la celda B1 de la Hoja 2.
• Te posicionas en la celda a la que deseas pasar el dato (en nuestro caso B1 de la Hoja 2) y tecleas el signo +,
• Luego haces clic con el botón derecho del ratón sobre la etiqueta de la Hoja 1, vas a la celda A1 y presionas Enter.
• Automáticamente se copiará el dato en la celda B1.
Hay que tener en cuenta que cada vez que se cambie el valor de la celda A1 se cambiará también el de la celda B1.
Método 2
• Te posicionas en la celda a la que quieres pasar el dato (en nuestro caso B1)
• Presionas las teclas =+ y a continuación escribes el nombre de la hoja desde donde pasaras el dato (Hoja 1), luego presionas la tecla ! y a continuación escribes la celda donde se encuentra el dato que deseas pasar (A1).
En nuestro ejemplo sería: =+Hoja1!A1
Al igual que en el caso anterior cualquier modificación del valor de la celda A1 provocará una modificación de la celda B1.

Fuente: http://es.kioskea.net/faq/2585-pasar-datos-de-una-hoja-excel-a-otra#q=como+pasar+datos+de+una+hoja+de+excel+a+otra&cur=1&url=%2F

NIVELES DE ANÁLISIS DE LA RENTABILIDAD EMPRESARIAL

analisis1


Aunque cualquier forma de entender los conceptos de resultado e inversión
determinaría un indicador de rentabilidad, el estudio de la rentabilidad en la empresa lo
podemos realizar en dos niveles, en función del tipo de resultado y de inversión
relacionada con el mismo que se considere:
??Así, tenemos un primer nivel de análisis conocido como rentabilidad
económica o del activo, en el que se relaciona un concepto de resultado
conocido o previsto, antes de intereses, con la totalidad de los capitales
económicos empleados en su obtención, sin tener en cuenta la financiación u
origen de los mismos, por lo que representa, desde una perspectiva
económica, el rendimiento de la inversión de la empresa.
??Y un segundo nivel, la rentabilidad financiera, en el que se enfrenta un
concepto de resultado conocido o previsto, después de intereses, con los
fondos propios de la empresa, y que representa el rendimiento que
corresponde a los mismos.
La relación entre ambos tipos de rentabilidad vendrá definida por el concepto
conocido como apalancamiento financiero, que, bajo el supuesto de una estructura
financiera en la que existen capitales ajenos, actuará como amplificador de la
5
rentabilidad financiera respecto a la económica siempre que esta última sea superior al
coste medio de la deuda, y como reductor en caso contrario.


Fuente: http://ciberconta.unizar.es/leccion../anarenta/analisisR.pdf